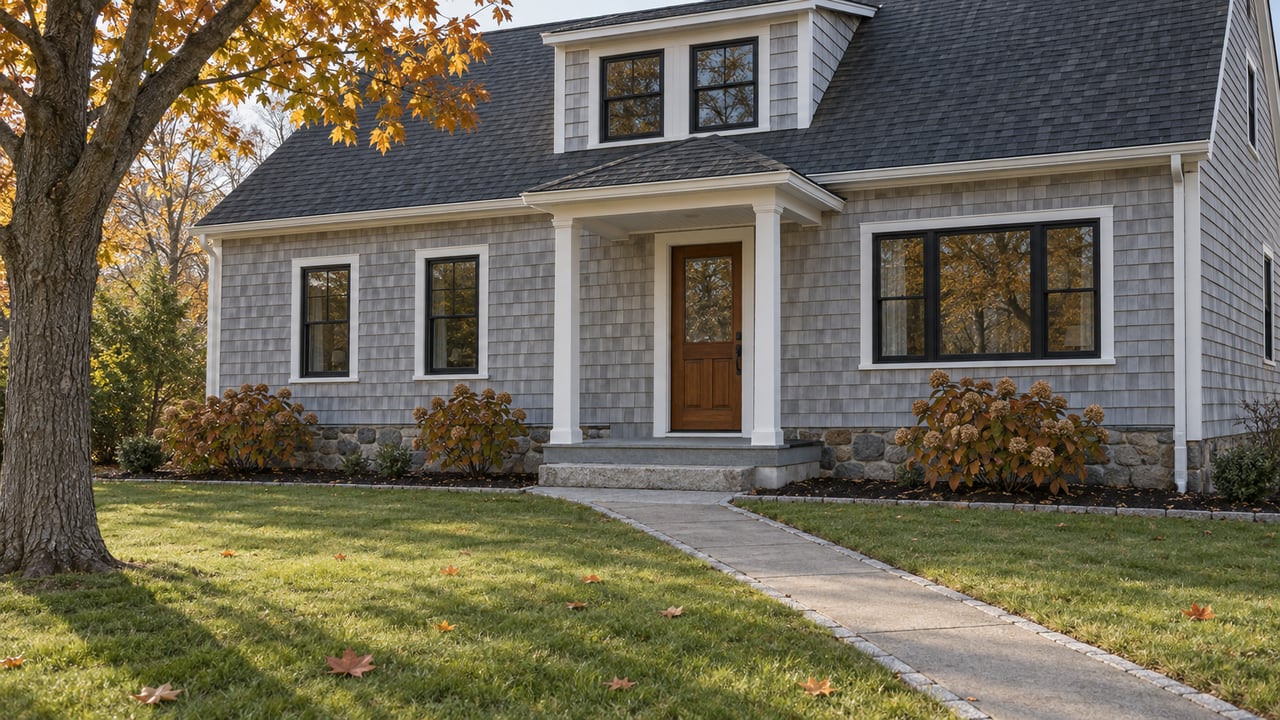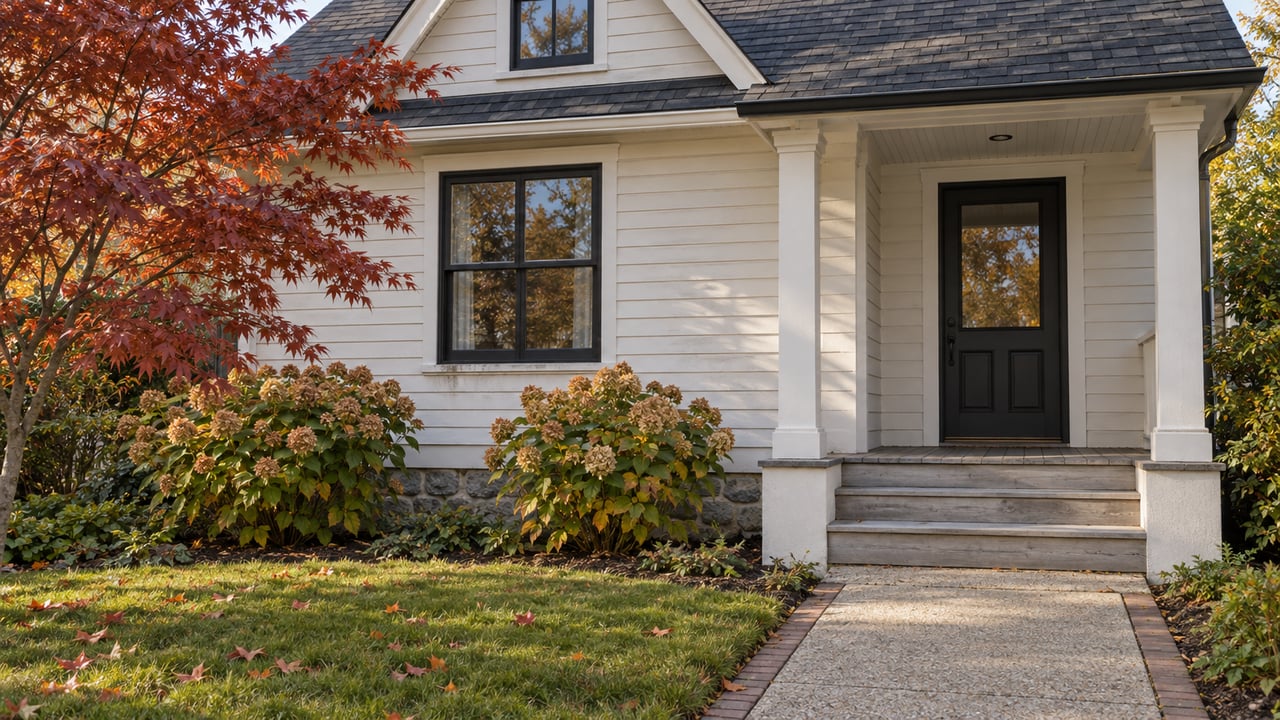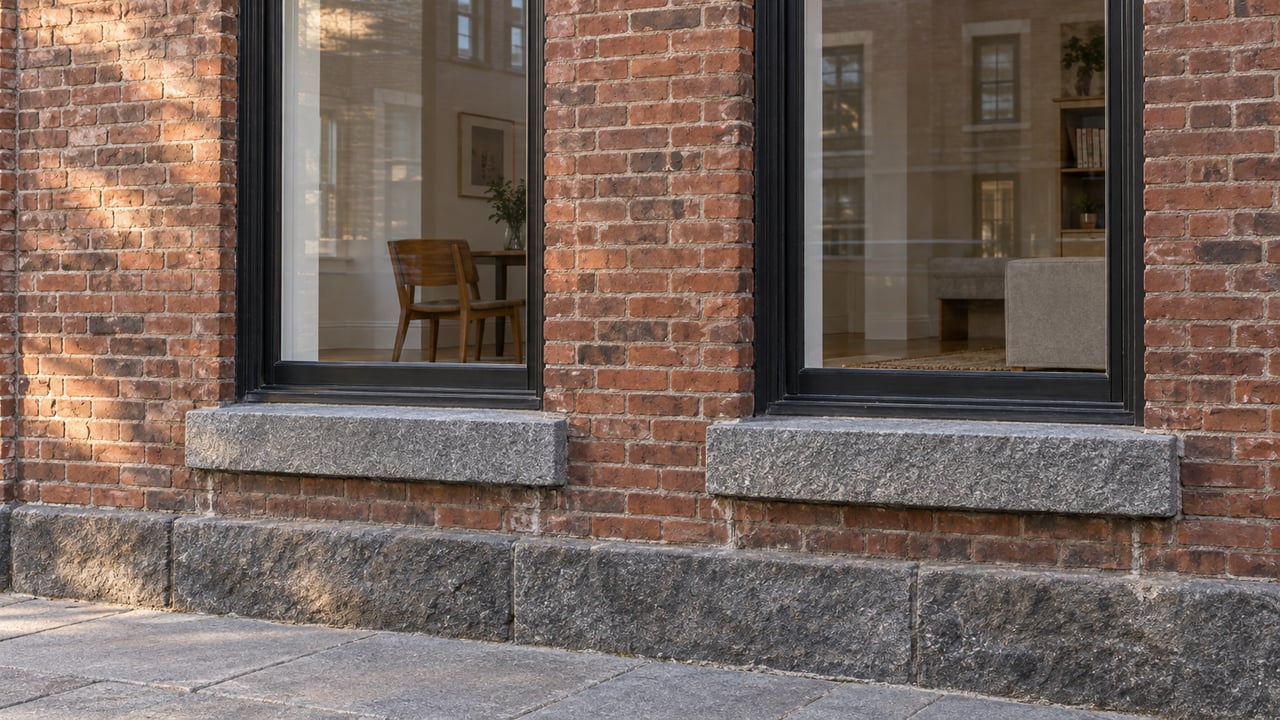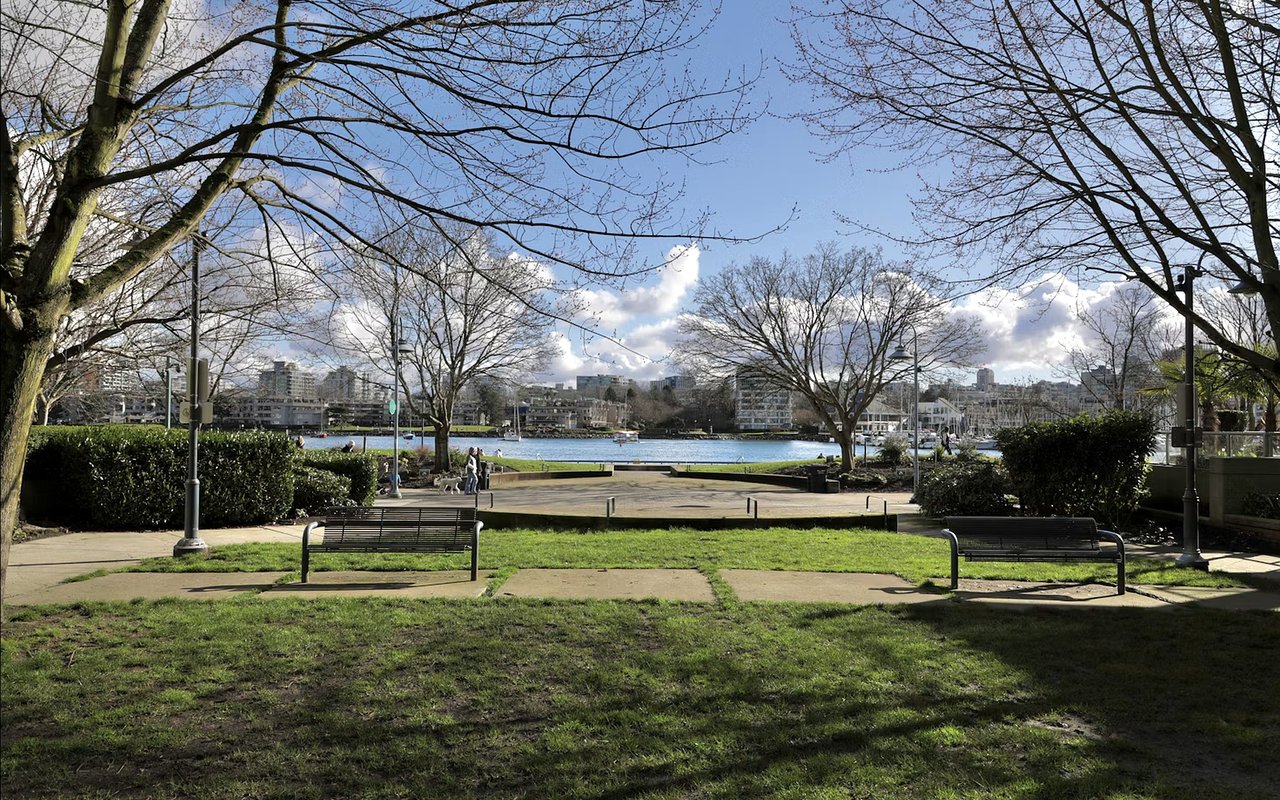
Providence, Rhode Island real estate operates as a competitive market where median single-family home sale prices reached $580,000, while citywide average property values stand at $418,040. Properties in high-demand micro-markets including College Hill, Fox Point, and the East Side sell in an average of 43 days with multiple competing offers.
Evaluating Your Next Real Estate Move in Providence?
Compare available inventory across Providence luxury condos, historic East Side single-family residences, and multifamily investments:
Providence functions as a collection of distinct micro-markets rather than a single uniform map. College Hill, the East Side, Downtown, Fox Point, Federal Hill, and Elmhurst each move with their own transaction velocity and valuation logic. The latest market metrics continue to show resilient price growth, relatively tight inventory levels, and neighborhood-level variances that dictate buyer leverage far more than citywide averages alone.
Citywide Pricing Overview and Core Metrics
Providence property values continue to experience steady upward momentum across multiple independent valuation benchmarks. The spread between average index values and closed transaction medians highlights the concentration of luxury and multi-family sales on the East Side and adjacent historic corridors.
Recent valuation metrics across Providence reflect steady annual gains:
- Average property index valuation: Zillow records Providence at $418,040
- Median closed sale price: Redfin records the latest citywide median at $580,000
- Active listing price baseline: Realtor.com indicates a median listing price of $425,450
- Year-over-year direction: All major property tracking sources record positive annualized appreciation across the urban core
Inventory Velocity and Buyer Competition
The Providence market rewards listings that are priced with precision and properly prepared for debut. Inventory absorption remains swift when initial asking prices reflect immediate street-level comparables.
Key velocity indicators across the Providence urban core include:
- Competing offer frequency: Properties positioned in desirable neighborhoods receive an average of two competing offers
- Citywide marketing period: Closed sales average 43 days on market from listing to accepted contract
- County pace comparison: Providence County overall recorded an average pace of 35 days on market in early 2026
- Buyer selectivity: Well-maintained single-family homes and turn-key condominiums experience immediate buyer urgency, while deferred maintenance listings face longer negotiation windows
Neighborhood Value Variances Across Providence
Aggregated city averages often obscure the sharp valuation contrasts separating individual neighborhoods. A condominium in Downtown Providence, an income-producing multi-family in Fox Point, and an estate home near Blackstone Boulevard operate under distinctly different pricing dynamics.
The primary submarkets that drive citywide volume include:
- East Side: Established high-value territory commanding superior price per square foot across colonial and revival estates
- College Hill: Historic prestige adjacent to Brown University and RISD, commanding the top luxury tier in the city
- Fox Point: High pedestrian walkability near Wickenden Street and India Point Park with strong multi-family and townhome pricing
- Downtown: Contemporary loft and condominium housing providing accessible entry points compared to historic East Side inventory
Providence Market Benchmark Comparison
Market Geographic Area | Median Sale Price | Average Days on Market | Year-over-Year Growth | Dominant Housing Stock |
|---|---|---|---|---|
Providence Citywide | $580,000 | 43 Days | Positive Growth | Historic Single-Family, Multi-Family, Condos |
East Side / College Hill | $825,000+ | 28 Days | Above Average | Historic Colonials, Federal Brick, Townhomes |
Downtown Providence | $385,000 | 48 Days | Moderate Growth | Loft Conversions, High-Rise Condominiums |
Providence County | $496,000 | 35 Days | +10.2% | Suburban Single-Family, Multi-Family |
State of Rhode Island | $525,700 | 38 Days | +4.5% | Statewide Residential Mix |
Source: Rhode Island Association of Realtors (RIAR) MLS reporting, Zillow Research Index, and Redfin Market Trackers.
Strategic Advisory for Sellers and Buyers
The current market calls for pricing discipline over speculation. Sellers must ground asking figures in hyper-local street sales rather than broad municipal metrics. Presentation, professional architectural photography, and accurate physical condition dictate how rapidly a listing captures buyer attention in its first ten days on market.
For buyers, strategic positioning requires pre-approval and immediate readiness when desirable homes launch on the East Side or in Fox Point. While inventory overall remains constrained, buyers have become increasingly selective regarding price alignment and mechanical condition.
Authored by Nelson Taylor and The Blackstone Team at Compass
Nelson Taylor and The Blackstone Team represent one of Rhode Island's top-producing residential real estate partnerships. Based in Providence, the team specializes in historic preservation properties, luxury East Side residences, and analytical market advisory across Providence County and coastal Rhode Island.
Connect with The Blackstone Team to receive a personalized market analysis for your Providence property.
Frequently Asked Questions
Are Providence home prices still rising?
Providence home values continue to demonstrate year-over-year growth across municipal and county records. Providence County recorded a 10.2 percent annual median price increase to $496,000, driven by sustained regional demand and constrained housing inventory.
Which Providence neighborhoods carry the highest price points?
College Hill, Wayland Square, and the broader East Side carry the highest median prices in Providence. These historic neighborhoods feature preserved nineteenth-century architecture, immediate access to Brown University and RISD, and enduring buyer demand.
Is Providence still competitive for well-priced homes?
Turn-key properties priced in alignment with neighborhood comparables regularly attract multiple offers within their first two weeks on the market. Properties across Providence average 43 days to contract, while high-demand East Side listings frequently sell faster.
How does Providence real estate pricing compare to Boston?
Providence real estate provides substantially greater purchasing power than greater Boston, offering comparable historic architecture and walkability at approximately half the price per square foot. Commuter rail access via the MBTA Providence Line supports continued relocation interest from Massachusetts buyers.
```[cite: 1] Would you like to proceed with the next target from the queue (Target #2: Cranston Condos Money Page), or paste HTML for another target URL? - Proceed to Target #2 (Cranston Condos Money Page) - Proceed to Target #1 (Garden City Living Blog) - Proceed to Target #8 (What It's Like to Live in East Providence) - Switch MODE to AUTO